
MCP Inspector Explained: Debugging at the Protocol Layer
What is MCP Inspector
MCP Inspector is a standalone MCP client built for debugging MCP servers. It connects directly to your server so you can invoke tools and resources manually and see the raw JSON-RPC requests and responses, without routing everything through an AI client. MCP Inspector works by splitting responsibilities between a local proxy and a browser-based UI, making protocol behavior visible, deterministic, and testable. That makes basic questions easy to answer: Did the tool get called? Were the inputs valid? Did the schema validate? Did auth fail? Did the server reject the request, or did it never receive it?
So if you build or maintain MCP servers, the Inspector is not optional tooling. It is the reference lens through which MCP interactions become understandable.
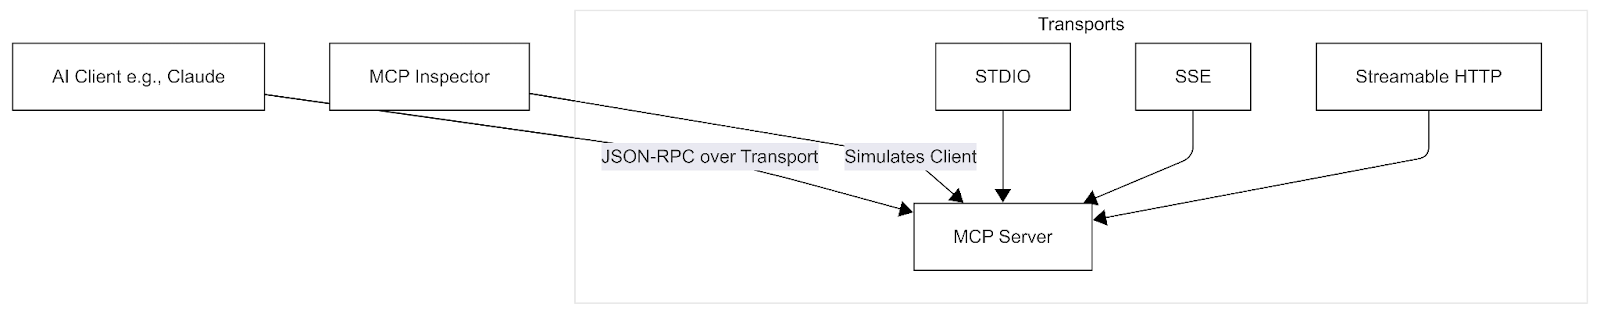
Figure 1. How MCP Inspector connects to an MCP Server
Why AI Clients Hide MCP Server Errors
Most MCP failures do not look like failures. A tool call can “succeed” but return nothing. A resource subscription can stall without an obvious error. An authorization failure can surface as a timeout. And if you only exercise MCP servers through an AI client, those signals get more murky because of model behavior, retries, and partial responses. The protocol might be doing exactly what it’s supposed to do, but you cannot see it clearly.
MCP Inspector removes the model from the loop and shows MCP interactions at the protocol boundary, including the raw JSON-RPC traffic. What people write off as “AI weirdness” is usually something concrete: a transport edge case, a schema mismatch, or a lifecycle bug. With the MCP Inspector, those problems become visible, deterministic, and much faster to fix. And it’s the fastest way to debug MCP servers before you involve any agent framework.
Getting Started With MCP Inspector: Install, Run, and Connect to a Server
Launch the Inspector with npx @modelcontextprotocol/inspector. It starts a local web interface for connecting to MCP servers, either packaged or local scripts.
Fun Fact: The port mapping itself: 6274 for the Inspector UI (MCPI) and 6277 for the proxy (MCPP). The mapping aligns with phone keypad letters for M-C-P-I and M-C-P-P.
Core features include:
- Connection pane for transport selection and launch configuration.
- Tabs for inspecting and invoking resources, prompts, and tools.
- Real-time notifications pane for JSON-RPC logs and server messages.
- CLI mode for scripted interactions.
This setup, built mainly for rapid iteration: modify server code, reload, and retest.
How MCP Inspector Works: Proxy and Browser UI Architecture
The Inspector uses a two-component architecture: a Node.js proxy (MCP Proxy) and a React-based frontend client. Built primarily in TypeScript, it relies on the official TypeScript SDK for protocol handling.
MCP Inspector Components
MCP Proxy: Node.js backend that functions as an intermediary MCP client. It spawns or connects to the target server, manages transports, and exposes an HTTP API to the frontend. It handles security via session tokens and supports configurable timeouts.
Code snippet from server/proxy (simplified, based on repo insights):
1// Starting the proxy (excerpt from server/index.ts)
2const { startProxy } = require('./proxy');
3startProxy({
4  clientPort: process.env.CLIENT_PORT || 6274,
5  serverPort: process.env.SERVER_PORT || 6277,
6  host: '127.0.0.1',
7  authToken: generateRandomToken(), // Security hook
8});
Recent update (Dec 2025, commit fixing streamable-http-401-handling): Improved error propagation for remote auth failures, preventing silent drops during streamable HTTP sessions.
MCP Inspector Client (MCPI): React/TypeScript UI in client/. It communicates with the proxy via HTTP, rendering tabs for invoking tools, inspecting resources, and viewing protocol-level events.
MCP Inspector Data Flow
- Frontend sends requests to proxy via HTTP.
- Proxy performs JSON-RPC exchanges with the server over the selected transport.
- Responses and logs stream back to the frontend for display.
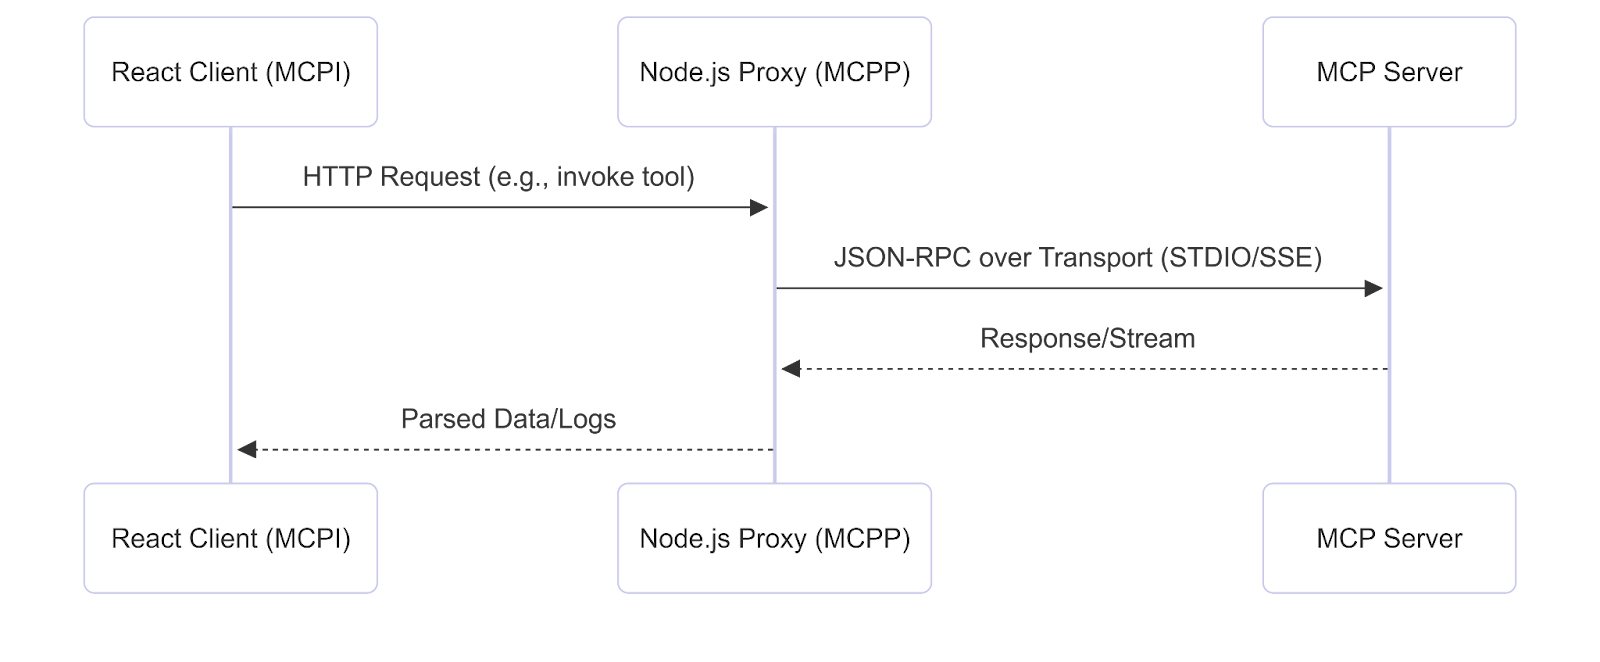
Figure 2. MCP Inspector data flow
The proxy design isolates the browser from direct server access, improving security while adding minimal overhead for development use.
MCP Inspector Limitations, Security, and Extensions
Comparisons: Vs. LangChain's tracing (more observability-focused), the Inspector excels in AI-specifics like prompt testing. Critiques: DNS rebinding risks in non-local setups; hardened by binding to 127.0.0.1 only.
Possible Extensions for 2026 workflows:
- WebSocket Support: Fork the repo, add to server/transports/ for lower-latency alternatives to SSE.
- Observability Integration: Hook Prometheus metrics into proxy for invocation stats, pull request via CONTRIBUTING.md.
- Custom Tabs: Extend React UI for graph visualizations of prompt templates (e.g., using D3.js).
Simple Hack: Clone the repo, run npm install, tweak server/proxy.ts for custom logging, and build with npm run build. Test with Docker for containerized envs.
Debug MCP Servers With MCP Inspector First
MCP Inspector turns “agent weirdness” back into normal engineering. When a tool call returns nothing or a subscription stalls, you do not want to guess whether the model, the client, or the server caused it. You want to see the protocol traffic, reproduce the behavior on demand, and fix the real failure mode.
A good rule of thumb is simple: debug the MCP layer in Inspector first, then bring the AI client back in. If it breaks in Inspector, it’s your server, your transport, your schema, or your auth. If it only breaks in the agent, you’ve narrowed the problem to orchestration, prompting, retries, or client behavior.
If you’re building MCP servers for real users, treat MCP Inspector like a core part of your dev loop:
- Reproduce the issue in MCP Inspector
- Validate inputs, schemas, auth, and lifecycle events at the protocol boundary
- Fix until behavior is deterministic
- Only then test through your AI client as an integration layer
And if your team is pushing MCP into broader environments, the next step is obvious. Start layering in stronger observability, tighter security posture, and targeted extensions like WebSocket transports or proxy metrics, so debugging stays fast even as your server surface area grows.
Further Reading

Customized Plans for Real Enterprise Needs
Gentoro makes it easier to operationalize AI across your enterprise. Get in touch to explore deployment options, scale requirements, and the right pricing model for your team.